My Analysis

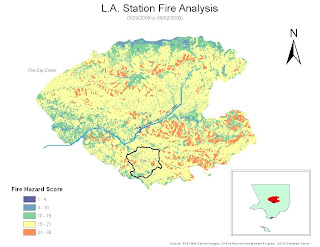
This map graphically displays the fire risk of the entire 2009 LA Station Fire area-- the region mapped is the entire area that was burned in the fire over the first five days. The map's data is from 2006 and 2008, meaning that the data should generally be consistent with the conditions prior to the LA Station Fire. The ‘Fire Hazard Score’ in the lower left hand corner incorporates slope and surface fuel type into the final score. A small score is a low fire risk area whereas a large score is high fire risk area. The small outlined portion is the extent of the fire at Day 1 (8/29/2009) and the entire colored region is the total extent of the station fire. To give map viewers a perspective on the size of the Station Fire, an inset map of LA County was provided. For reference, Big Tujunga Canyon Stream and Mill Creek were also plotted on the map.
The first step in creating this map was completing a similar tutorial provided by ESRI. The tutorial provided a walk-through of the primary steps necessary to complete the map. I was able to find GIS data from a variety of sources: UCLA GIS data (streams and county boundary), LA County Data (station fire perimeter), CA Fire Resource Assessment Program (surface fuels), and the USGS Seamless Server (elevation data). First, I merged the five day fire extent into one cumulative layer. Second, I made a hill shade layer to get a better feel for the study area. Next, I reclassified the surface fuel types so that more flammable vegetation types received higher scores. The same was done for the slope (higher slopes were deemed higher fire risks). Lastly, these scores were summed using the raster calculator and the final result is seen above.
I encountered a variety of problems in making this map. First, when I tried using the cumulative fire area as a mask, my result for slope was impossibly high-- I calculated changes of over 2 million percent. I found that if I used the LA County feature as a mask, this problem could be circumvented. Another problem I encountered was that I was not exactly sure how the surface fuel types/slope changes should be scored. I generally followed the tutorial for these scores, but some of the values were made using my best judgment. The last problem I encountered was independent of the GIS program—I had an inconsistent remote access connection with the UCLA lab computer.
No comments:
Post a Comment